Playing detective: 3 strategies for debugging Java when logs aren’t enough
Every single programmer learns early on in their career how to get familiar with whatever debugging tools that are most effective and/or popular in their language of choice. Java has jdb, jconsole, and many more; C++ has gdb; Python has pdb; etc. My personal favorites are the “kill -3” thread dump command, the good old Google search engine, and the powerful YourKit java profiler –– all of which we recently turned to when we discovered that some of our publishers in our pub/sub system stopped working. They weren’t shutting down, but all processing was coming to a complete halt. The logs indicated no failures, the disks and memory were fine, and the other services running on these boxes were all happily chugging away at their work.
New mystery means: The game is on!
Strategy #1: Thread dumps
Being an engineer can be a bit like being a detective — part of your job is to solve mysteries. The first thing I try when getting to the bottom of a Java mystery is grab a thread dump from the program. Thread dumps are massively fun, with hints of issues that don’t show up in logs, even if I switch on trace logging.

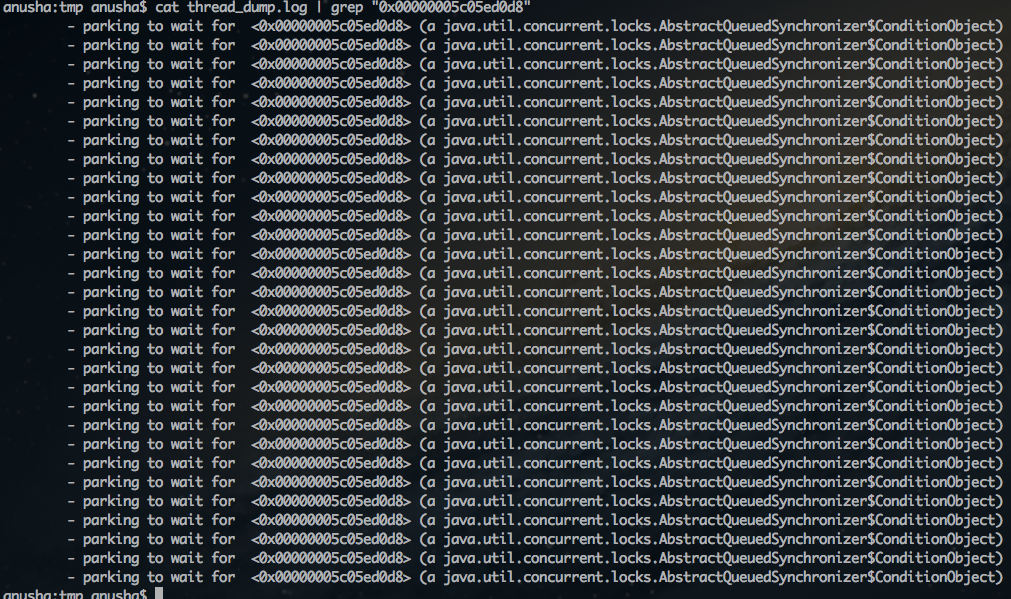
Figure 1: Thread dump search
In this case, when some of our publishers in our pub/sub system stopped working, the fun began when a colleague and I sat down to look at the Java thread dumps. All the threads were waiting on the same thing: a ReentrantLock that no thread seemed to be holding. Case of the Missing Lock! We had a missing lock and not a thread in sight associated with it. This ReentrantLock was in the code of a GenericKeyedObjectPool from the Apache Commons repository. Apache Commons is a well-used open code base and we didn’t believe it had any issues. The next place to search for leads: Google.
Strategy #2: Google (or your preferred search engine)
Most issues that we run into are not unique to our use of Java and someone else in the world has either run into it before or at least has complained about it on the internet. With all the resources that a search engine provides, there is no reason not to search the world for a potential answer. Even if your case is unique, sometimes answers to questions about related issues can spark a good idea that will lead to a solution.
A missing ReentrantLock and fully locked threads seemed like an issue that someone else would have run into, so we turned to Google. After a bit of investigating, we determined that we had hit a JVM bug: there were two related OpenJDK bugs and an Oracle Java bug that all pointed at a stack overflow during critical sections that then corrupts data and can potentially cause deadlocks. The issues were found in JDK7 and will be fixed in JDK9. However, increasing the stack size only prolonged the time it took for these publishers to hit the issue. The tests indicated that the thread dumps had been corrupted due to that JVM bug and the missing lock was a printing issue and not the true issue we needed to solve. Case of the Missing Lock: solved. Case of the Frozen Publishers: frustratingly open.
Strategy #3: YourKit (or your preferred Java profiler)
It was time to bring out the heavy duty guns: YourKit, a powerful Java profiler which we mostly use in its less powerful mode: remote debugging. With YourKit, we can see into a running program and capture a heap dump, a more detailed thread dump, or even determine deadlocks. When our programs run into large memory sizes, we have found YourKit can handle heap dumps that are 10 or more gigabytes in size, a common heap size when you are dealing with a lot of data.
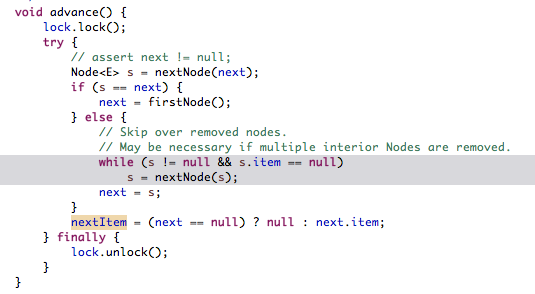
The next time the publishers had trouble processing, we attached YourKit and started monitoring the status. Within a few minutes, we noticed that the one of the threads was actively working, unlike what the thread dump had implied. The one that held the lock was actually running in the Apache Commons version of GenericKeyedObjectPool, where it was waiting for a return on a LinkedBlockingDeque.advance() operation.

Figure 2: The source of the infinite loop (highlighted in grey)
When we went to check if the version of Apache Commons we had been using had a bug report for it, turns out that there was one. The thread that held the lock would get into an infinite loop and all the other threads that were trying to access the GenericKeyedObjectPool would block on accessing the lock, turning it into a starvation scenario. Our fix was easy: just use the latest version of Apache Commons with the proper fixes. We have verified the version update and made sure other operations were not affected by the upgrade and it looks like the infinite loop was the culprit. Case solved!
When debugging Java programs with issues that are confounding, it is always good to have some tools that you understand. My trusty tools are thread dumps, YourKit and Google. This issue has deepened my appreciation in these tools and they can be good to have in your toolbag.


